Hydrographic Data Analysis
Total Hydrographic are your certified Hydrographic Surveyors and Marine Mapping/GIS professionals.
Our Services
Bathymetric Surveys
Side Scan Sonar Surveys
Hydrographic Data Analysis
Terrestrial Surveying
Hydrographic Consultancy
Bathymetry is the study and mapping of the sea floor. Bathymetric surveys allow for us to measure the depth of a body of water as well as map its underwater features. Bathymetic data is used in a range of applications, some include:
- Hazard Detection
- Safety of Navigation and Nautical Charting
- Determiniation of Maritime Boundaries
- Environmental Management, including developing baseline data
- Research for Coastal and Marine Processes
- Installation of Maritime infrastructure
At Total Hydrographic we gather bathymetric data in a variety of different methods and equipment. Our Multibeam Echosounder (MBES) is a full bathymetric seafloor coverage system. The MBES system emits 512 beams in a fan shape beneath the boat allowing the system to capture up to 200,000 soundings per second and ensure maximum coverage of the seafloor.
Our Single Beam Echosounder (SBES) on the other hand, captures data using a single beam directly below where the system is mounted. Single Beam surveys are at a pre-defined line spacing; for example 2m, 5m, 20m. The size of these intervals determines the final resolution of the survey.
Multibeam survey and Single Beam surveys are each best suited to their own individual set of circumstances, locations and client needs. Total Hydrographic can help by recommending a particular solution specific to your own requirements and priorities as both MBES and SBES have their individual strengths and capabilities.
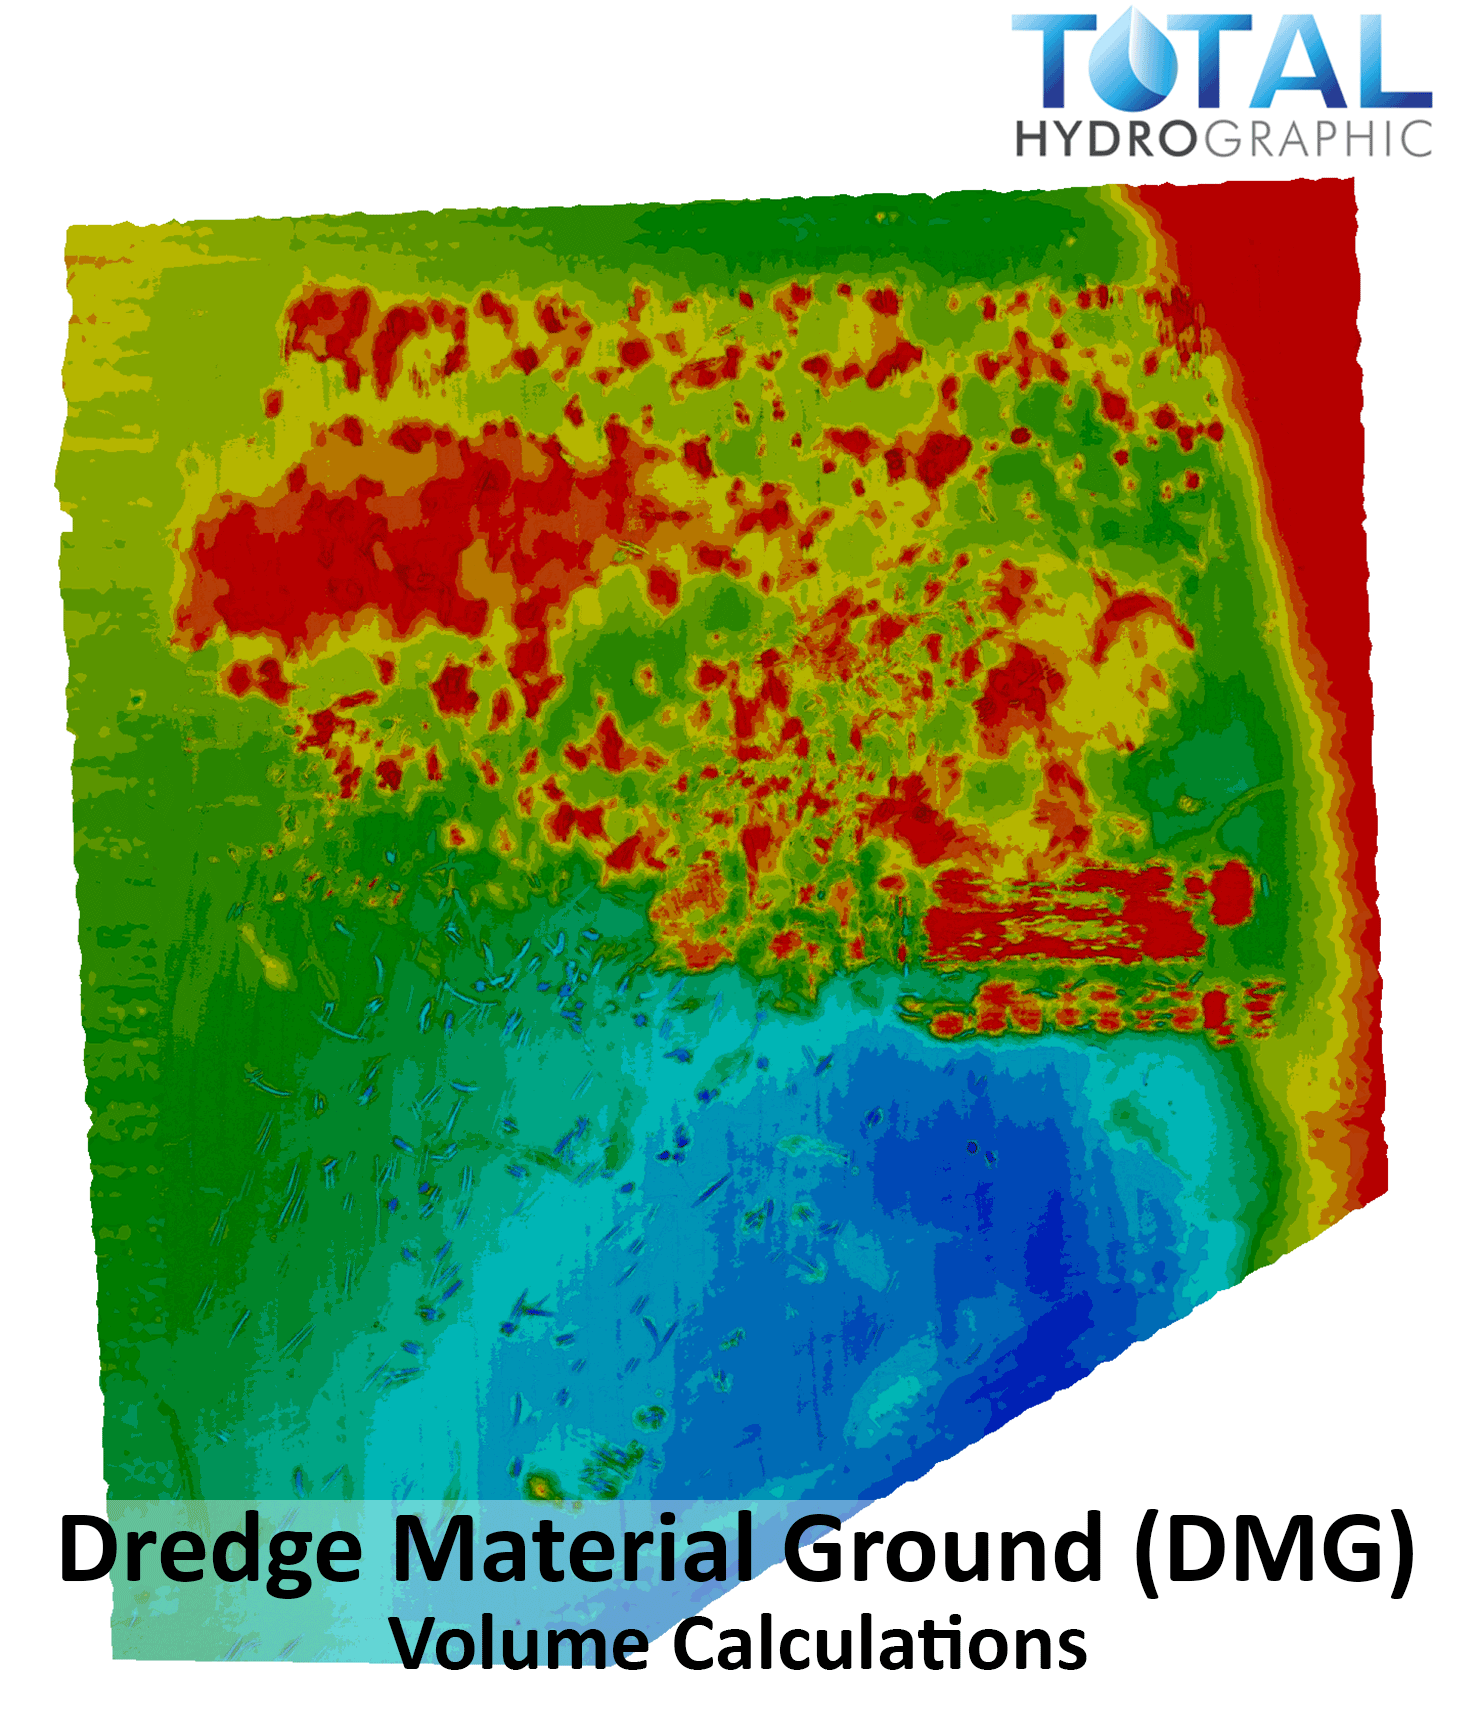
Volume Calculations
Total Hydrographic regularly conducts volume calculations for Reservoir and Dam capacities, Pre and Post Dredging Volumes, monitoring of Sedimentation and Erosion, and quantifying scouring of material around the base of bridges.
Volume capacity surveys can be used to determine water capacity at the time of survey, as well as providing capacity graphs and look up tables for future water depths. Our dredging survey services include pre, progress and post dredge surveys to determine volume of material to remove to meet channel design or target depth, and volume of material that has been removed during the dredge campaign.
Our range of survey vessels from the 6.2m Broadbill Catamaran down our 2.4m Mercury Inflatable and 1.5m ROV, have all been custom fitted to accommodate either our in house Multibeam Echo Sounder (MBES) system or Singlebeam Echo Sounder (SBES) system. We are able to provide a variety of different bathymetric survey options depending on the size, scale and resolution of your survey requirements.
Our extensive hydrographic data analysis allows for Dredging Managers, Council/Regional Authorities, Environmental Scientists and Water Management Teams to make accurate and informed decisions by using data that is quantifiable; removing the need for guesswork.
Sediment Ingress and Egress Analysis
The ingress and egress of silt, sand and other sediments in the marine environment is a natural process that can impede waterways if being deposited, or lead to erosion off of beaches or man made structures. Working with these natural processes and understanding their dynamics can help highlight risks or opportunities to stakeholders who have assets within these environments.
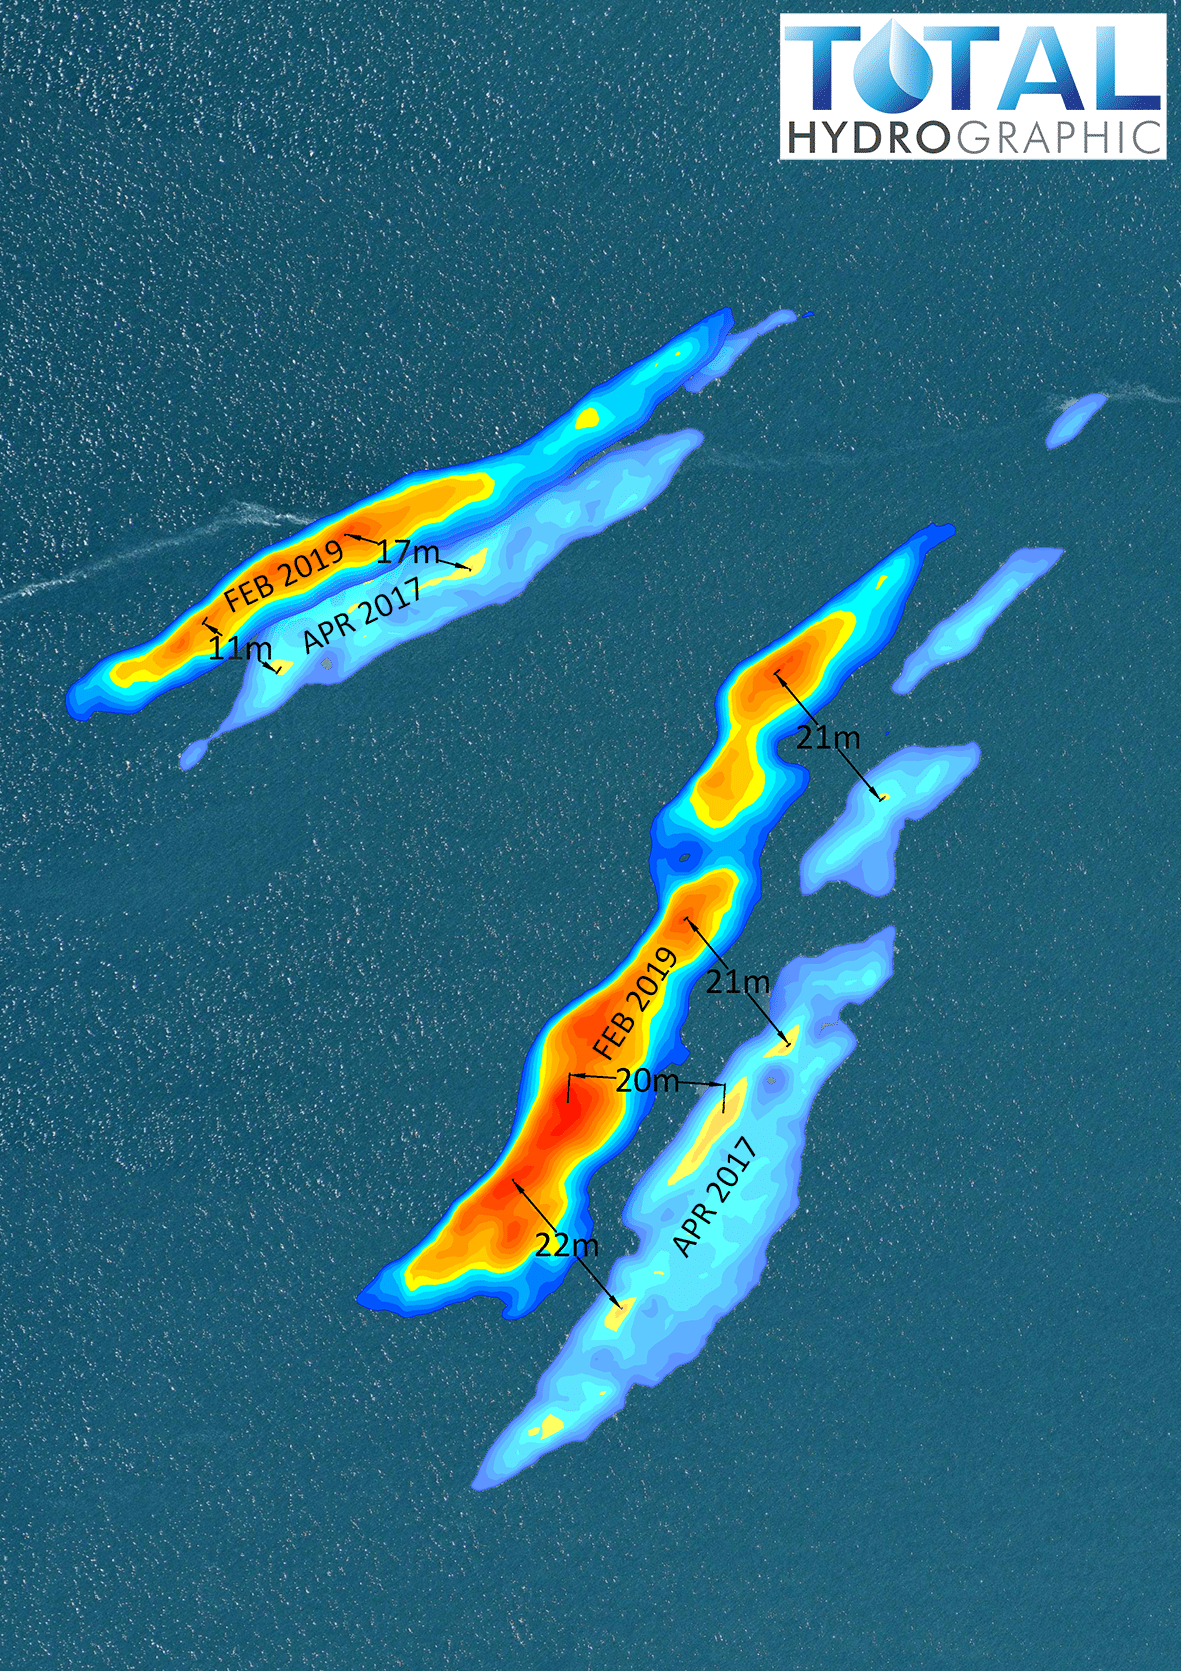
At Total Hydrographic, we have a variety of data analysis tools that help clients visualize and quantify these changes over time. Using historical data sets that the client has available or in house data sets that we have stored from previous surveys for our existing clients, we are able to develop 3D surface comparison charts.
With multiple surveys across a particular time period, means we are able to compare previous years data and analyse trends. Our 3D comparison surfaces allow for accurate positioning of ingress and egress of material, and highlight sediment dynamics over time such as sand wave movement. The data gained from this can then be used to determine volume changes over time, providing a quantifiable number to these natural processes and the ability to forecast intervention requirements.
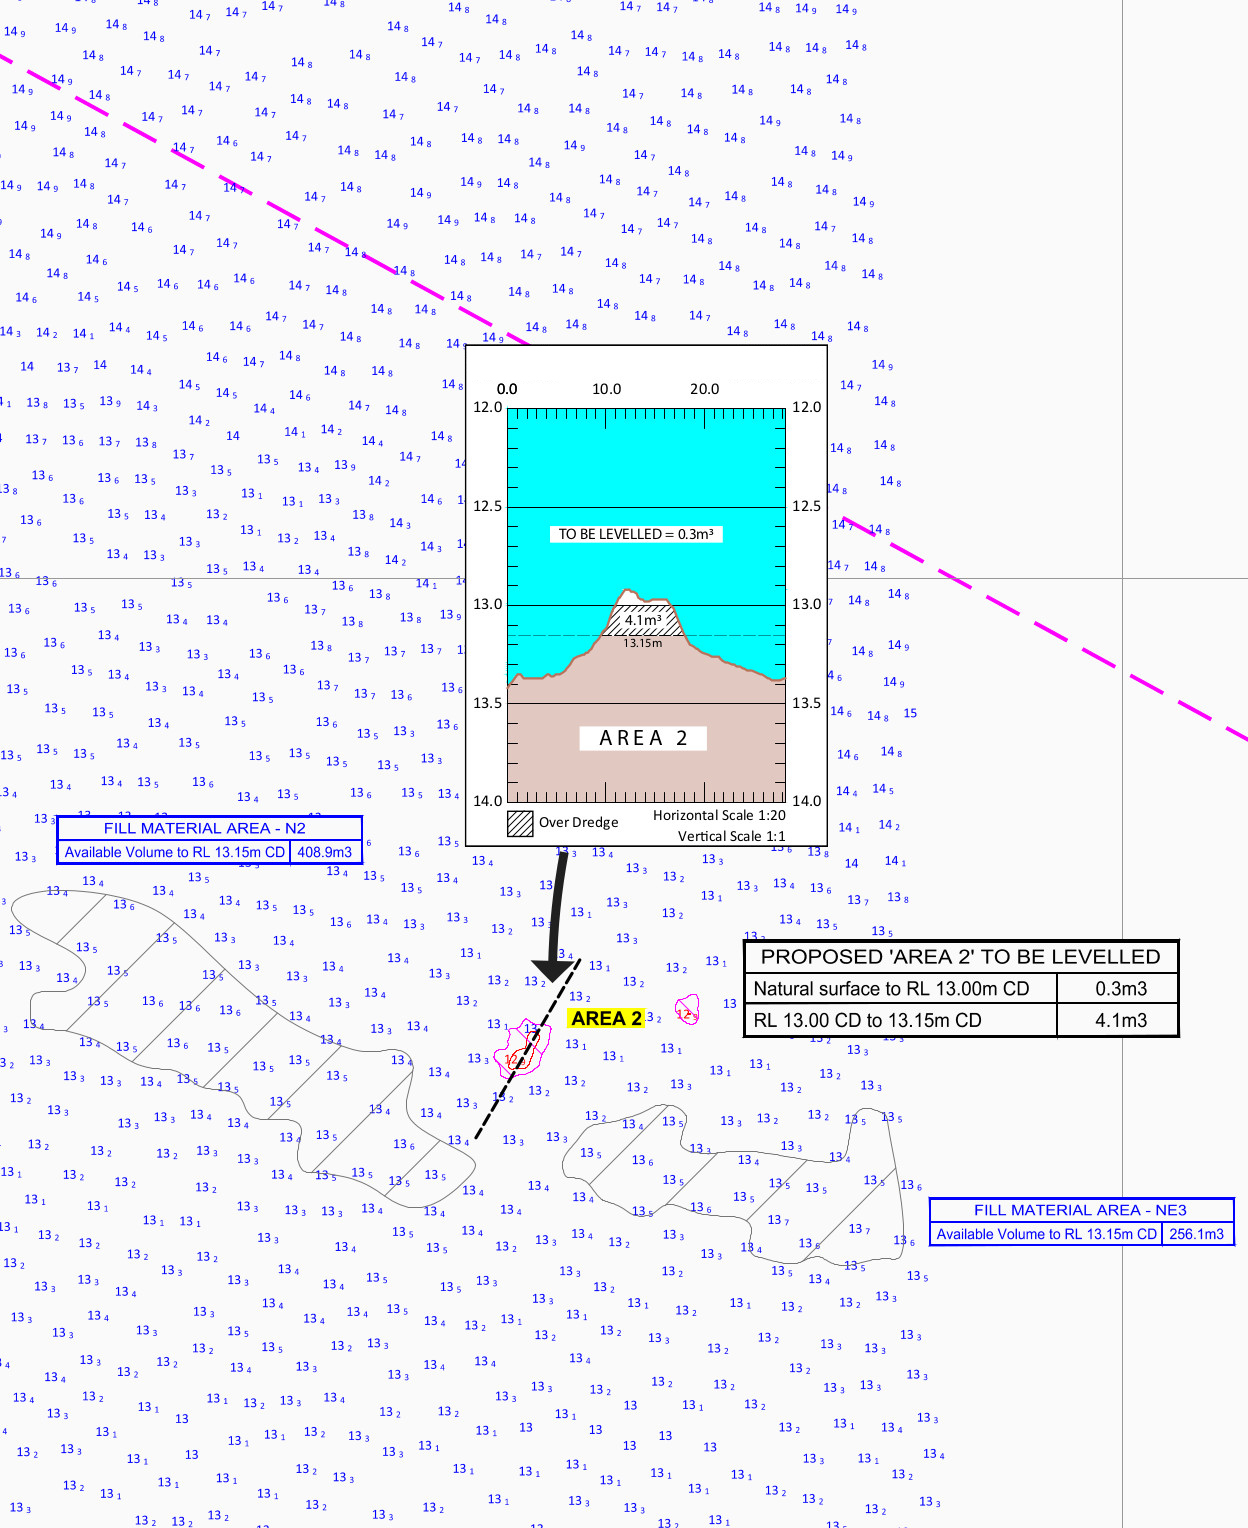
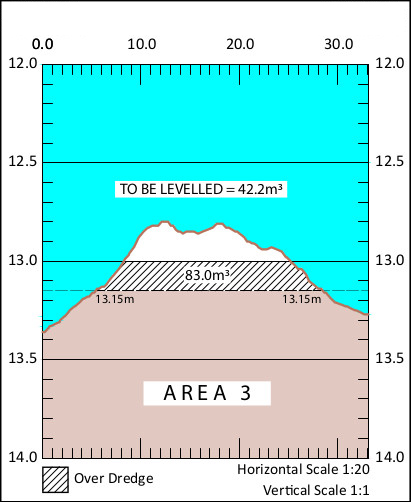
3D Design for Dredging or Renourishment
Dredging and Renourishment surveys are part of the backbone that makes up Total Hydrographics work. With each contract and client looking for a tailor-made product, we have become adept at being flexible to meeting those requirements .
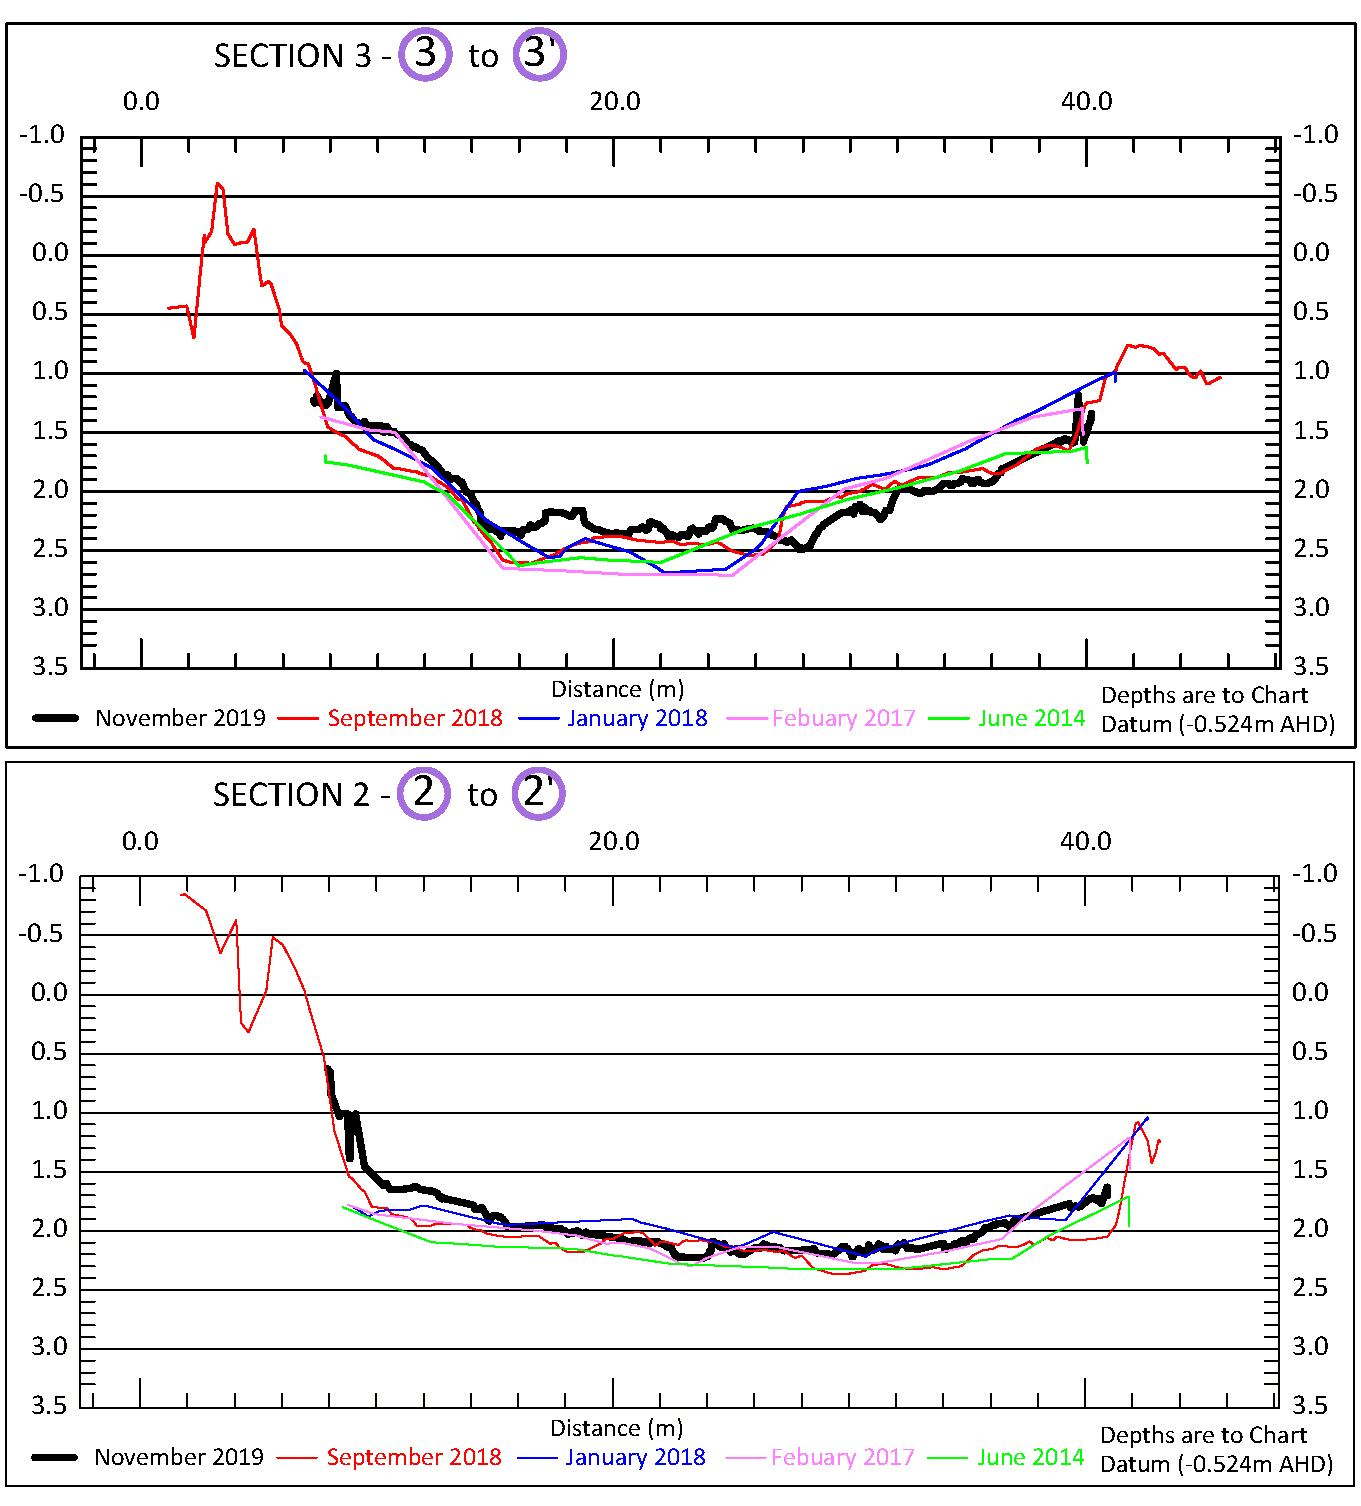
Our 3D design analysis for dredging or renourishment projects allows you to visualise your channel, harbour or beach renourishment design in a 3D space. The flexibility of these design capabilities can allow for volume calculations and 3D surface comparisons to be simply performed from your survey data. Total Hydrographic is also able to provide cross section comparisons between your bathymetric data and design depth, in an easy to view format.
We have experience with dredging and renourishment projects with Council and Regional authorities in Victoria and throughout Australia. Our 3D designs are there for managing authorities and engineers to make educated dredging and renourishment decisions.

3D Channel Design
The objectives of the survey was to provide full bathymetric survey and provide a volume assessment for the renourishment site to meet the 3D design model. The data that we provided allowed the client to make an informed decision, based on quantitative and visual data presentation, as to the best mode of practice for dredging and renourishment operations.

Reservoir Study
In a drought prone country like Australia, where millions of people rely on the country’s many reservoirs for a safe and dependable water supply – efficient, forward thinking and strategically planned reservoir management is crucial. The risk involved in reservoir management can be mitigated with quick access to relevant and accurate data.

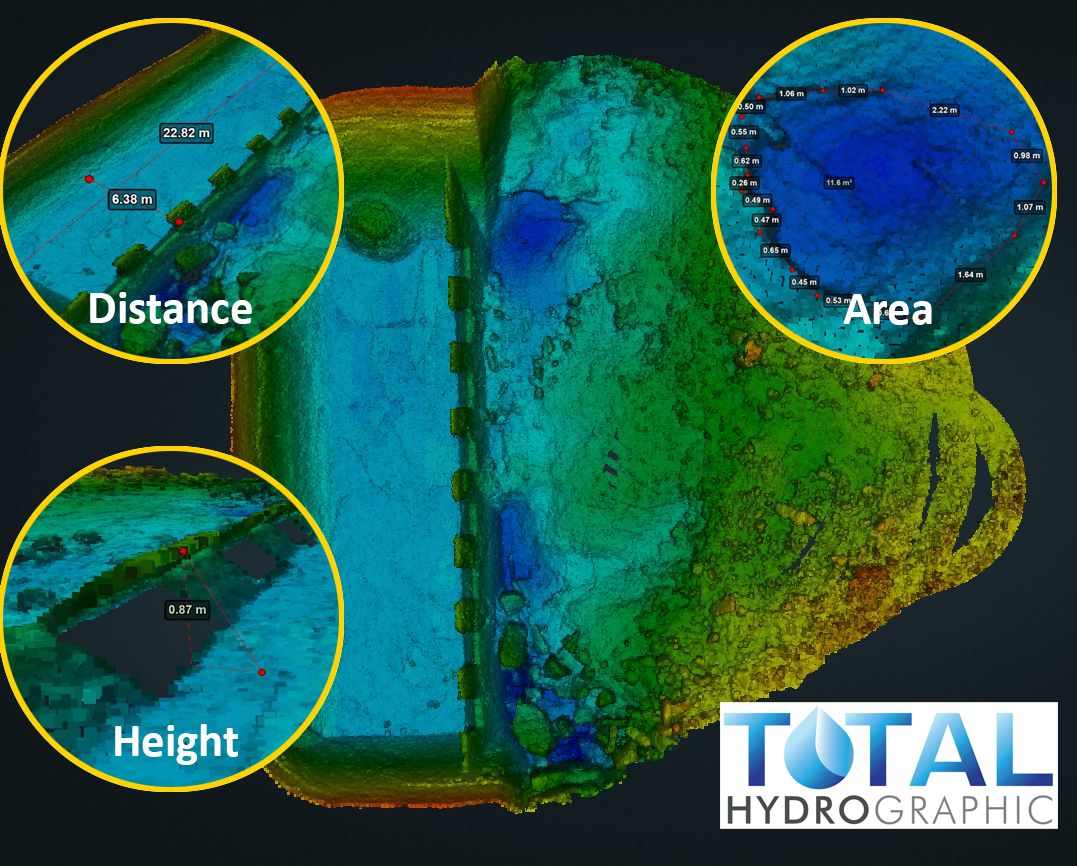
Underwater Inspection Survey
Total Hydrographic specialises in underwater survey and scanning and can utilise a variety of survey sensors to capture relevant data for clients. The Kongsberg MS1000 Mechanical Scanning Sonar used by Total Hydrographic is an example of a system that is ideal for inspecting underwater structures.
Capacity Curves and Look-up Tables
Strategic Planning, monitoring and maintenance of Dams and Reservoirs is made easier by regular bathymetric surveys. The ability to determine accurate volume calculations from surveying allows you to make informed decisions about water supply needs and manage mitigation strategies with more confidence.
The information that we gain from our bathymetric survey data, can be used to determine the capacity of the water in a reservoir, dam or closed body of water at the time of survey. Further analysis of this data set can be used to set up capacity curve graphs and look-up tables, providing a capacity of water for different water levels in the dam or reservoir.
Our work with local water authorities throughout Victorian have found this as a useful data analysis tool for their water supply management strategies. As a result they have been able to have accurate and up to date information all at their fingertips.

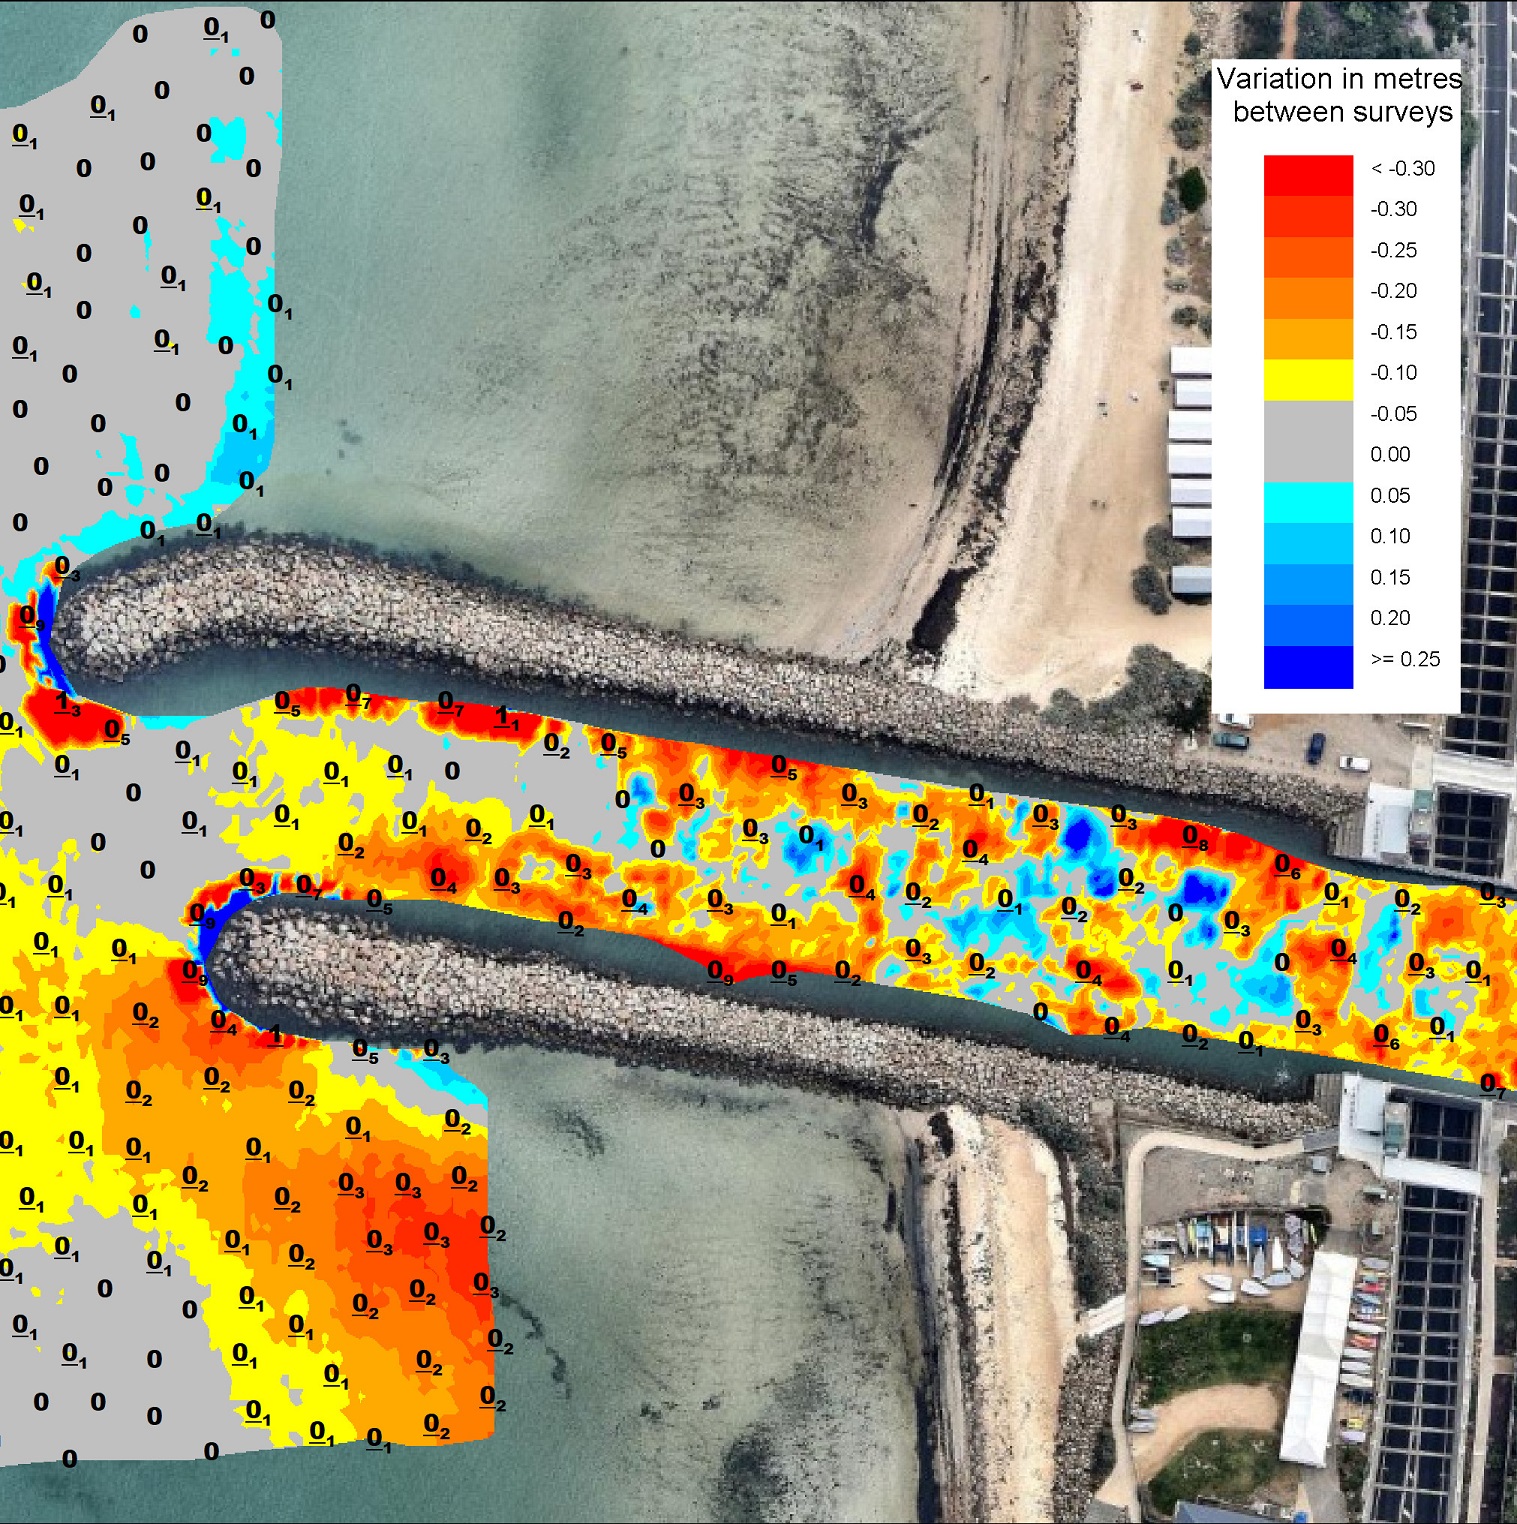
Change in Seafloor Time Lapse
Change in seafloor analysis is a great tool for investigating coastal processes (sedimentation and erosion), identifying changes in benthic habitats (biological oceanography) and determining bathymetric changes to sea floors pre and post major seismic events.
Time lapses start with regular bathymetric surveys, or at the minimum a pre and post event survey. Our in house R2Sonic 2020 Multibeam Echo Sounder and Starfish 990f Side Scan Sonar systems, can satisfy the needs of most survey requirements. When identifying changes in benthic habitats over time, bathymetry data gained from our multibeam system can effectively measure the growth of seagrass over time, by determining the change in the minimum Z range from one survey to another. The backscatter data extracted from the RAW multibeam files can help environmental scientists determine the distribution and stratification of benthic habitats from the varying frequency of the return signal. Our Starfish 990f is able to provide underwater imagery of these habitats and act as a ground truthing method for the above data samples.
The information gained from this survey analysis can provide valuable information into long term trends and dynamics of the marine environment. All of which can help provide accurate data for environmental management authorities, ports and harbour authorities, as well as local and regional councils to make accurate decisions over resource consents and asset management.
3D Visualisation
Even with the best data available, it can be difficult to make informed decisions without the appropriate visualisation techniques. 3D Visualisation can help bridge the gap between the surveyor and those who have less technical experience.
Total Hydrographic can produce high quality 3D outputs such as flythrough videos, interactive 3D models integrated 3D asset management services or presentations in freely accessible software such as Google Earth. 3D visualisation outputs are also a great way of stirring interest to your clients and stakeholders during presentations and media releases.
When coupling high resolution data with 3D visualisation packages it is a great way for the client to be able to get a clear understanding of their survey results. These packages allow clients to interrogate their data and make informed decisions with regard to the future, making them economical and cost effective.

Design Compliance Analysis
Often dredging, renourishment or construction projects in the marine environment work against engineering design drawings. In order to make the most informed decision, Total Hydrographic can compare and analyse survey data against design reference drawings in order to assess for compliance.
For example, a shipping channel must be maintained at a specific declared depth within its extents as per the design specification. Total Hydrographic can integrate a pre-existing design or generate a new channel design based on client specifications. By comparing survey data against the 3D design, the area can be assessed for compliance with non compliant regions identified for future actions.
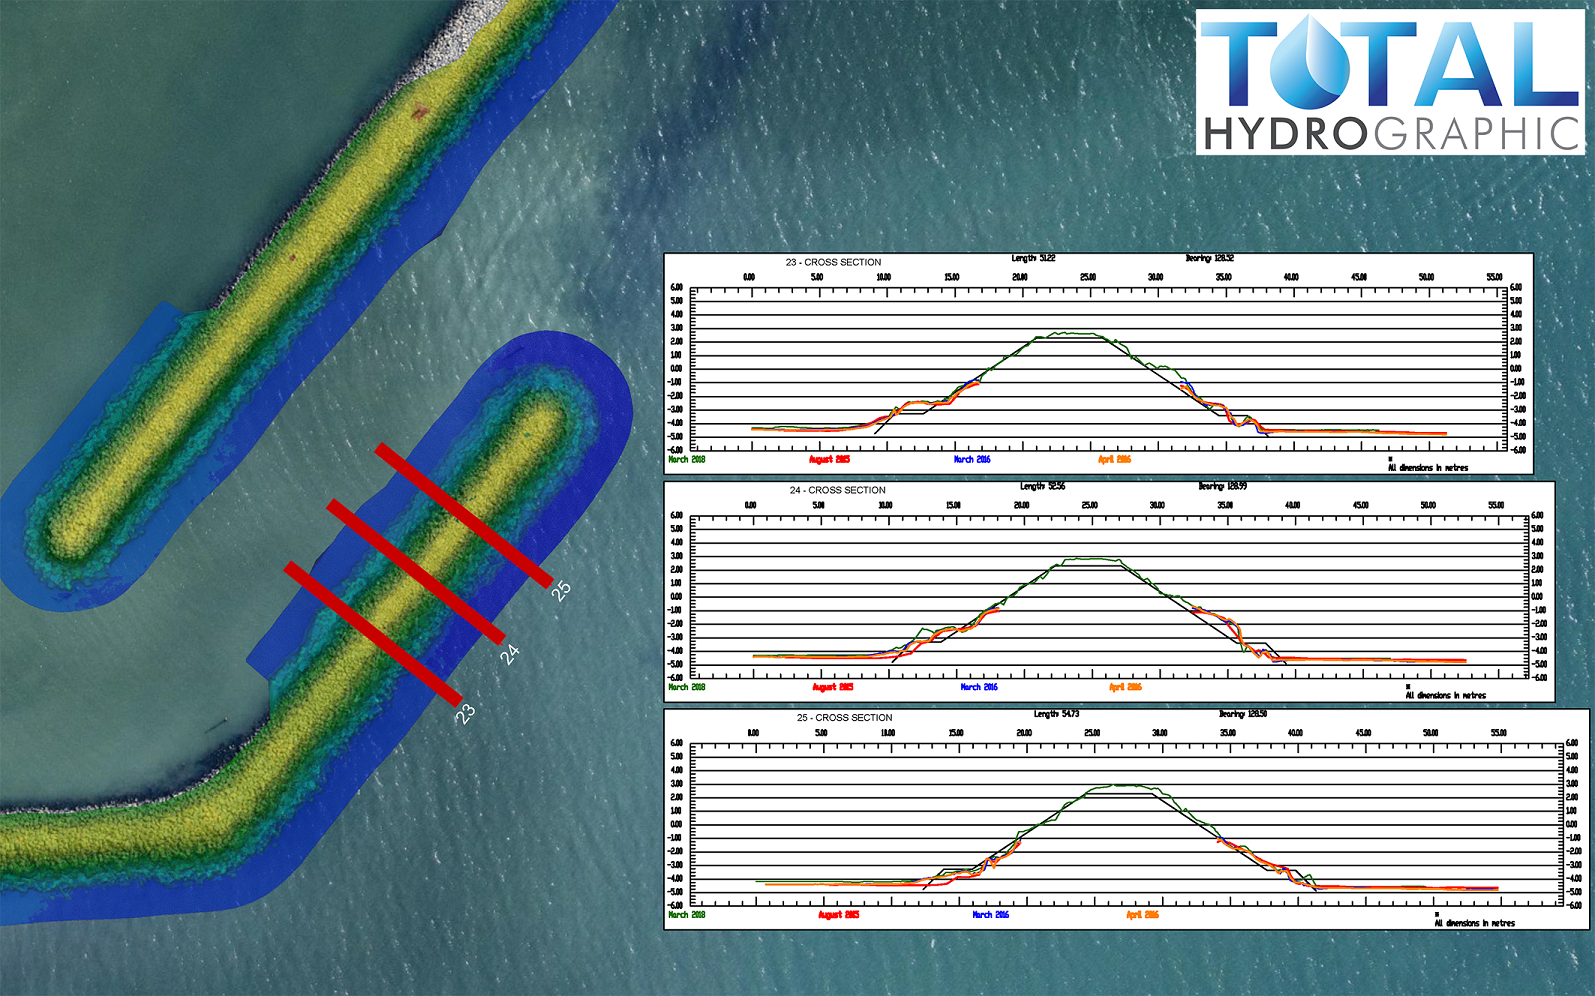
Harbour rock walls are another example of a coastal feature that require monitoring for deformation due to causes such as meteorological events. These features often require a combination of above and below water data captured and presented as cross sections. These cross sections can be accurately overlayed against engineering designs and verified for compliance.
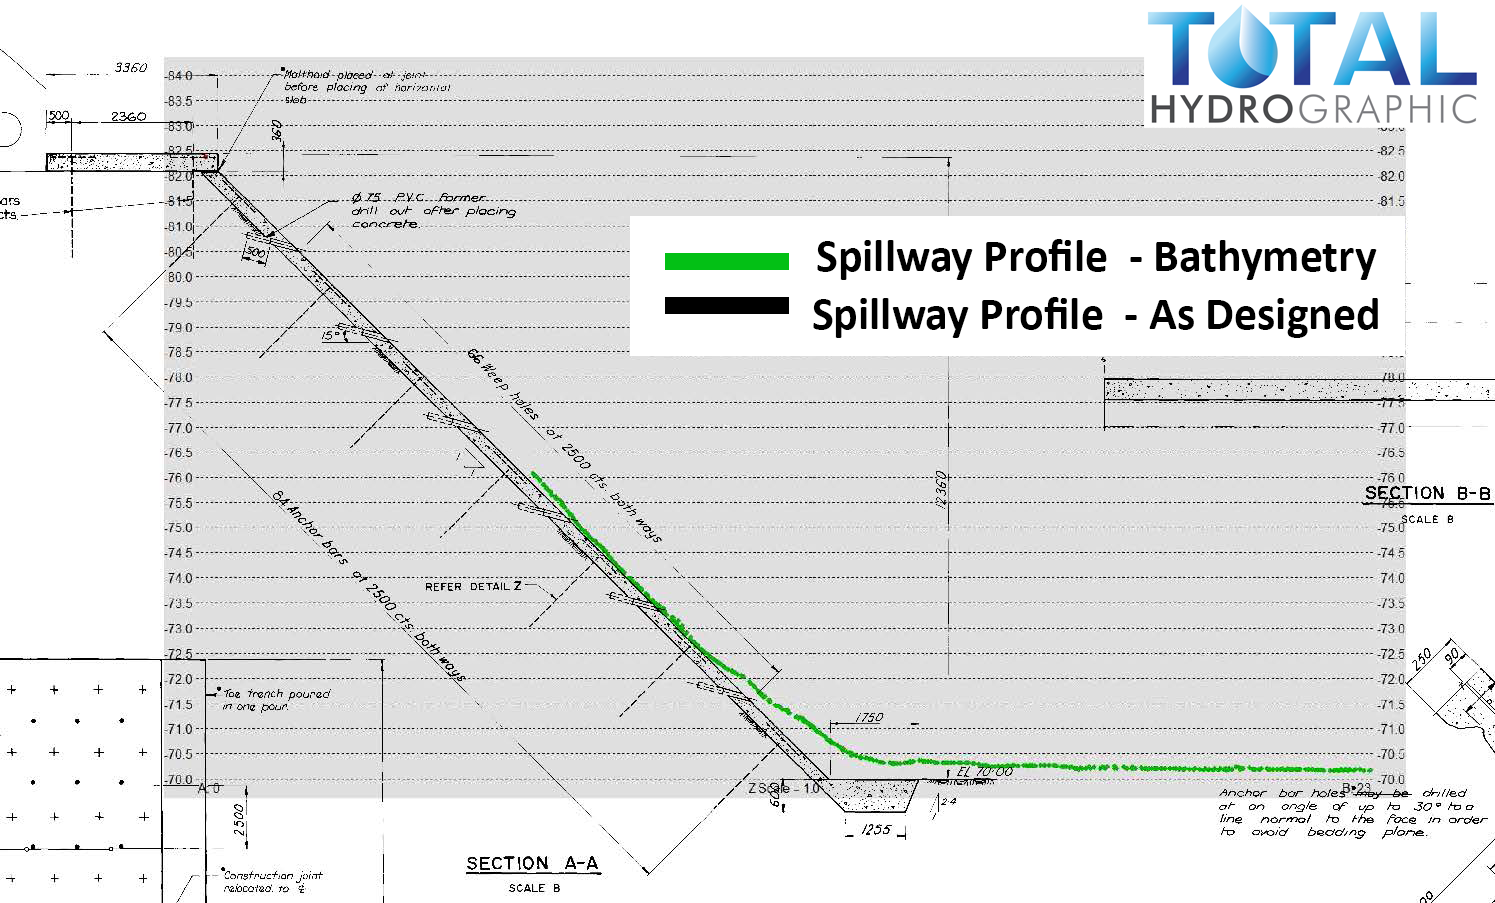
This type of analysis is also useful for older vertical structures such as bridge footings and dam spillways. By having accurate reference material to compare against, features such as deformation, temporal ingress/egress trends and foreign objects can be identified and dealt with.
Total Hydrographic has extensive experience in compliance analysis using both historic and recent survey data to evaluate and ensure your assets comply with design requirements.

Harbour Dredging
A corner stone of Total Hydrographic’s operations is to provide underwater survey solutions that can help Port and Harbour Authorities determine an appropriate dredging solution for their waterways. Dredging solutions often takes place because of sedimentation gradually encroaching in navigable waterways, and or when Port and Harbour authorities look to expanding their operations.
")
A Rockwall
This image is an extract from a hazard clearance survey of a lake. The client needed to know that there was a minimum clearance depth of water available at particular water levels. There were many hazards on the lake bed, however the survey revealed that they were all deeper than the client’s required minimum depth.

Submerged Trees
This image is an extract from a hazard clearance survey of a lake. The client needed to know that there was a minimum clearance depth of water available at particular water levels. There were many hazards on the lake bed, however the survey revealed that they were all deeper than the client’s required minimum depth.
Hydrography is the science of measuring and describing physical features within water bodies. Hydrography is used for navigation, habitat mapping and hazard identification.
Address
14/75 Endeavour Way, Sunshine West VIC 3020
79 Cook Road, Bli Bli, 4560, QLD